IAGD editors note: We are pleased to present a guest post by William Davis at Scripps Institution of Oceanography. This post walks through a teaching module on seismicity using Google maps, and some easy tactile methods for teaching earthquakes and tectonics. Supplemental material for this post can be accessed in this folder. Dr. Davis can be reached through his website, POSGEO. Enjoy!
Background
On April 6th 2009, a damaging earthquake struck the Abruzzo region in central Italy. This event killed 308 people, left tens of thousands homeless, and caused widespread damage throughout the nearby city of L’Aquila and surrounding areas.
As an undergraduate student, I had the opportunity to visit L’Aquila in 2015, in association with a seismic hazards field trip led by Dr Zoë Mildon. Being able to navigate around the damaged city helped me comprehend the severity of the event, and I found the experience to be a transformative point in my journey as an Earth science student.
Using Google Street View to explore seismic hazards
When I was recently a teaching instructor for a seismic hazards course at UC Berkeley, I wanted to be able to give the students a similar memorable and impactful experience. But critically, I wanted the experience to be inclusive and accessible. So, I created a lesson plan to simulate a visit to L’Aquila in an online setting. I was able to do this through the use of Google Street View. This is a free, browser-based tool within Google Maps, that shows panoramic views from a car-level perspective for many streets in the world. This imagery can be navigated by shifting the viewing direction, changing position, as well as viewing the same location at different times (Figure 1).
Figure 1. A demonstration showing the use of Google Street View to visualize building damage in L’Aquila (close to 69 Viale Duca degli Abruzzi). The area can be explored by shifting the viewing direction, zooming in or out, changing position, and changing the time the image was taken.
I was able to find certain areas in L’Aquila which had Google Street View imagery both before and shortly after the 2009 earthquake. This provided a unique opportunity to view interactive scenes of the earthquake-affected area.
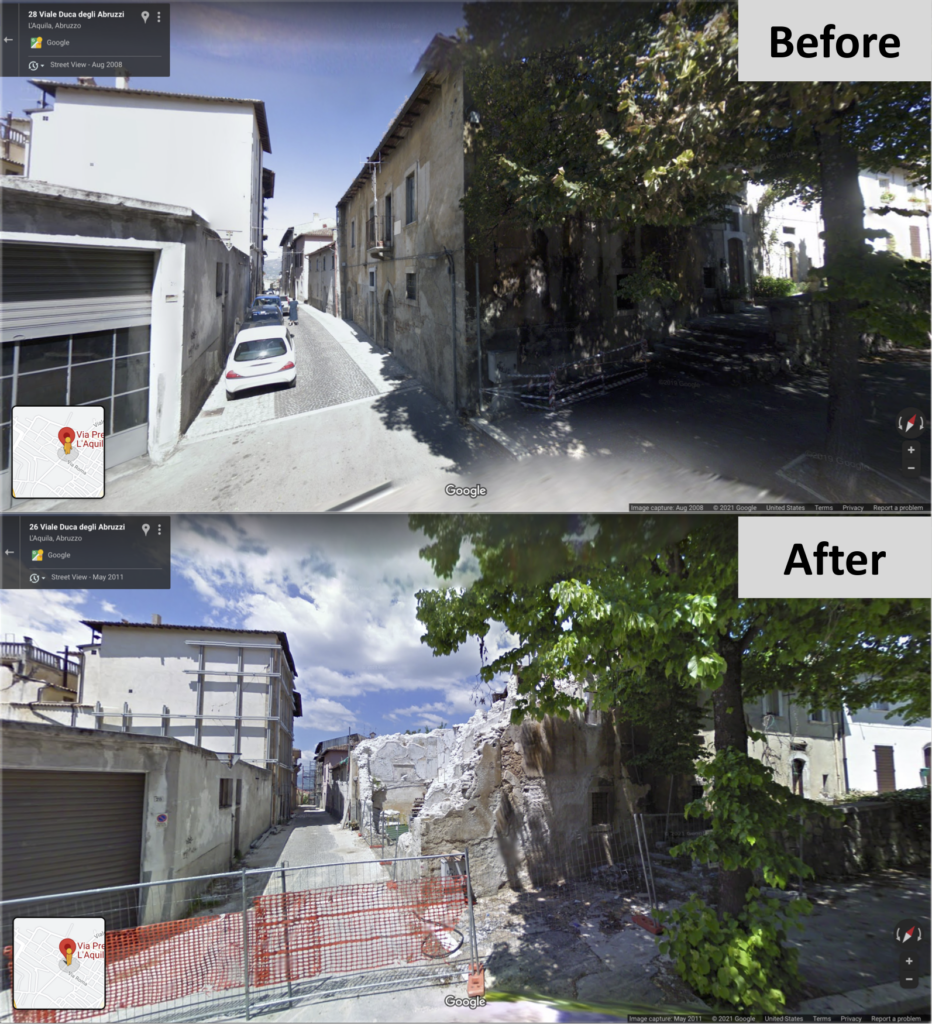
Figure 2. Google Street View imagery near Viale Duca degli Abruzzi. The top image was taken before the earthquake, in August 2008. The bottom image was taken after the earthquake, in May 2011.
I developed a lesson plan that facilitates active learning in an online setting. Students were tasked to virtually navigate to specific areas in L’Aquila, and to complete certain tasks, such as recording observations, quantifying damage, and creating a damage report.
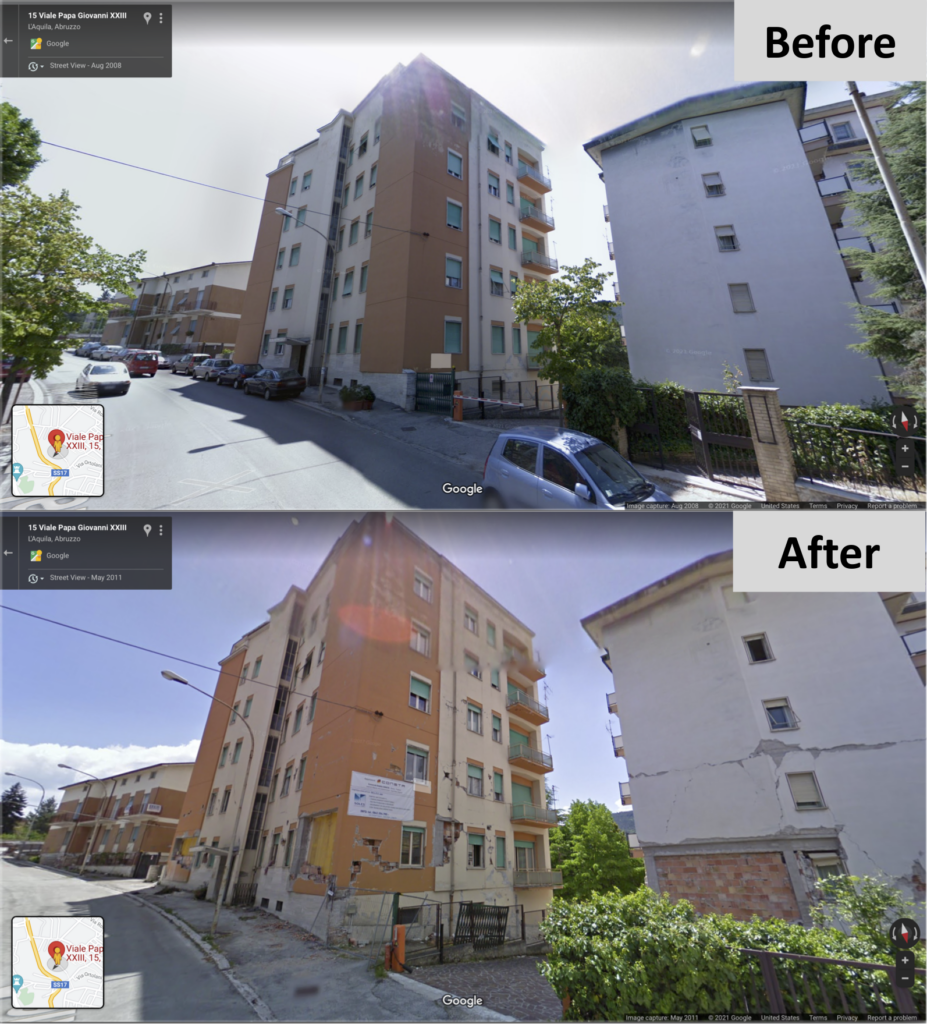
Figure 3. Google Street View imagery near Viale Papa Giovanni XXIII. The top image was taken before the earthquake, in August 2008. The bottom image was taken after the earthquake, in May 2011.
Initial feedback has been overwhelmingly positive, with the students quickly embracing the digital field trip environment. One student wrote:
“[…] I was able to better understand the effect of earthquakes on buildings. Additionally, I think Google Maps provide a great opportunity for students to (virtually) travel to different places and time periods!”
A full lesson plan is available here, or alternatively, as supplementary material to the publication: Davis, W. (2021). Google Street View as a Teaching Tool for Assessing Earthquake Building Damage, Seismol. Res. Lett. XX, 1–3, doi:10.1785/0220210148.
I invite educators in seismology, active tectonics, earthquake engineering, and other areas to utilize and experiment with this lesson plan. I hope that it can provide an inclusive and accessible experience for students. I’d like to highlight Dr Dan Frost (University of South Carolina) and Dr Zoë Mildon (University of Plymouth), who are using this lesson plan in courses they teach. I’m sure that similar exercises can be made for other earthquake damaged regions. If anyone has any suggestions, please reach out to me (w1davis@ucsd.edu).
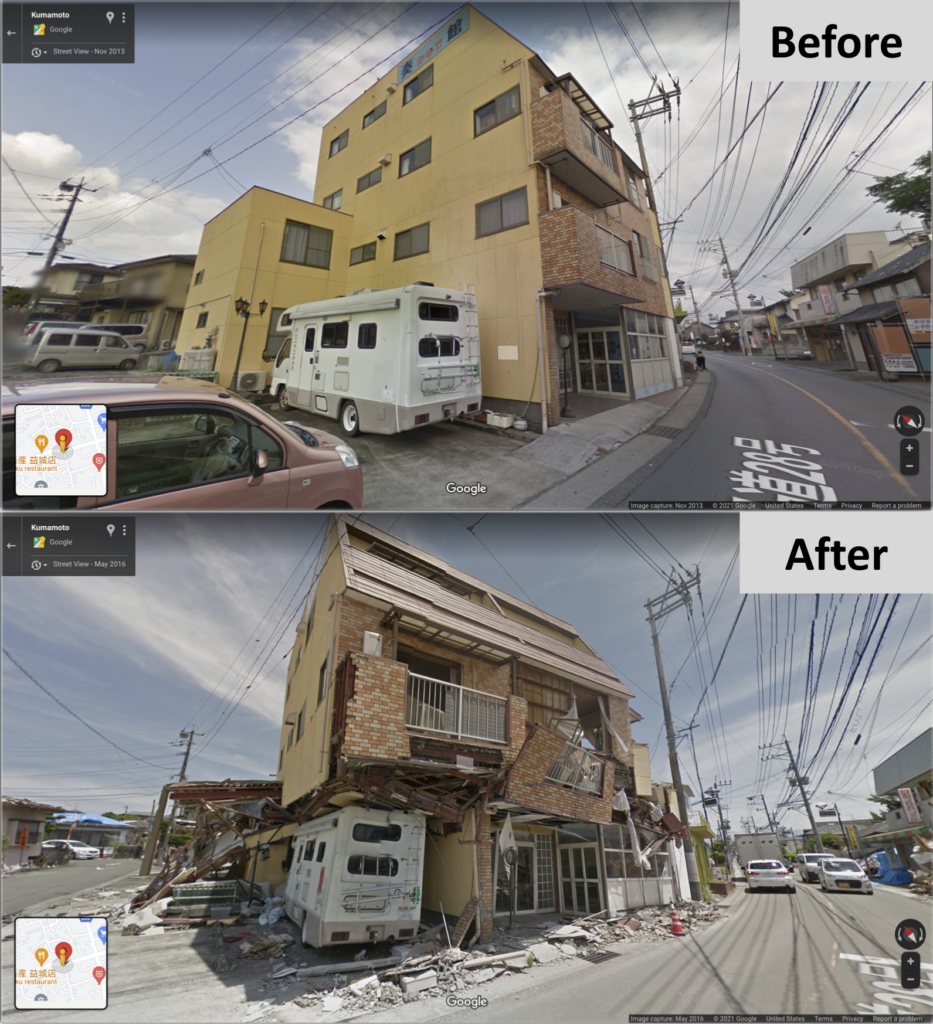
Figure 4. Another area for a possible Google Street View earthquake damage exercise: near Kumamoto 861-2241, Japan (32°47’21.5″N 130°48’56.6″E). The top image was taken before the earthquake, in November 2013. The bottom image was after the earthquake, in May 2016
Postscript: Tactile teaching tools for seismology
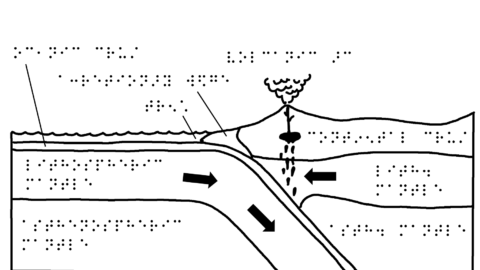
Another opportunity I had during the seismic hazards course was to create tactile teaching material for a student with visual impairment. Although I was aware of the IADG tactile Image Repository, and I did (in principle) have access to a tactile printer, I needed a fast and inexpensive solution to aid my teaching. I ended up making a variety of handheld diagrams out of materials like foam, felt, and cardboard.
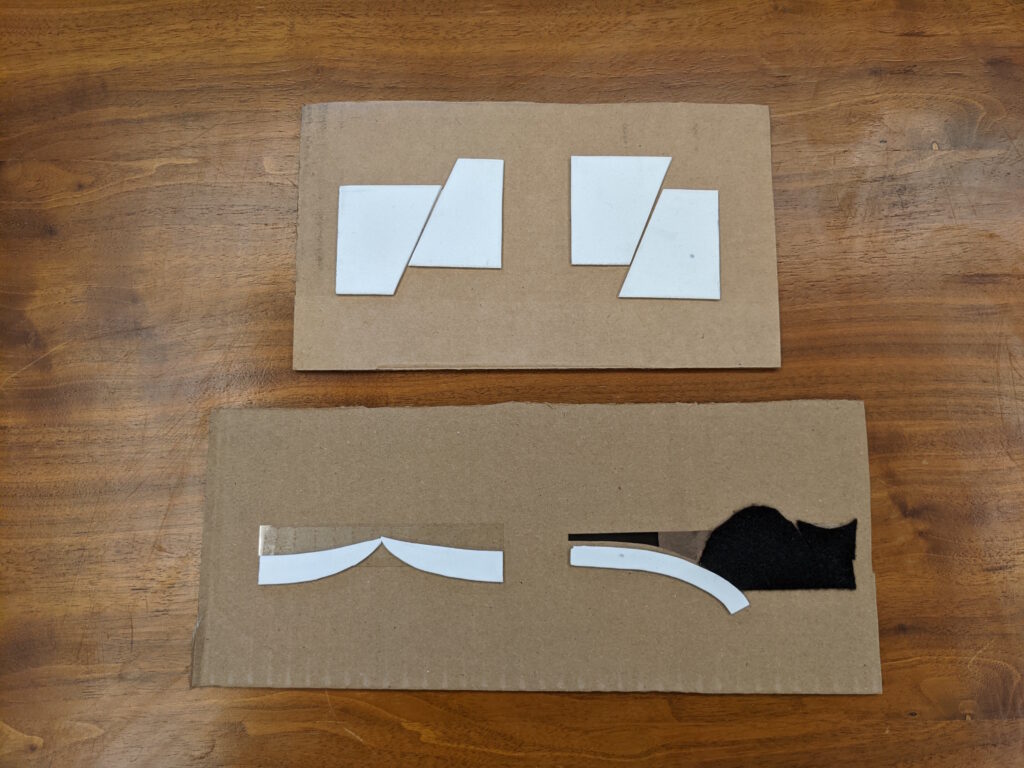
Figure 5. Handheld tactile diagrams to teach the concepts of faulting and tectonic plate boundaries. The upper diagrams are made of foam on a backing of cardboard. The lower diagrams are similar, and also use felt and acetate sheet.
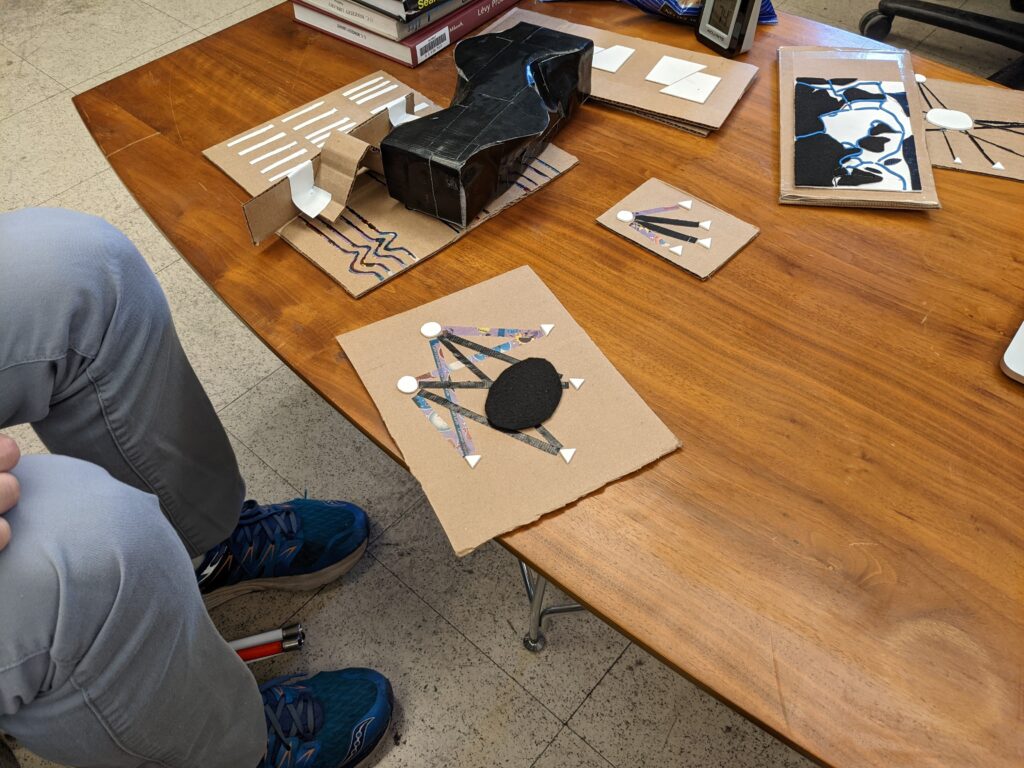
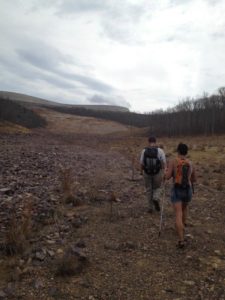
Figure 6. Other assorted tactile teaching tools made from readily available materials.
These tactile teaching tools enabled me to efficiently convey seismic concepts, conduct activities, and run study sessions. In principle, these objects could be used in combination with printed media from the IADG tactile Image Repository. The resources I created are now in the collection of the Berkeley Seismological Laboratory, and are available for use by future instructors.
Do you have ideas or tools to make teaching, learning, or doing geoscience more accessible? Consider writing a guest post for us! Contact info@theIAGD.org to get started.